Key Fundamentals: Sales, Margins, Return On Equity
Return On Equity: How Efficient A Company Is
With Its Money
ROE is one of the most popular ways to evaluate the
financial performance of a growth company. ROE, sometimes
called earnings power, indicates how well a company
is being managed to allow a profit on its shareholder's
money. It is also a reliable indicator of what a company
can earn in the future. High ROEs, year after year,
tend to reflect increasing profitability and superior
management. Cyclical stocks, those that roughly move
along with the economy, usually show more mediocre ROEs.
You should generally avoid companies with less
than 17% return on equity. ROEs vary among
industries, but this is the minimum you should find
acceptable. And be sure to compare a company's ROE against
others in the industry to get a realistic comparison.
In most industries, the top-performing companies tend
to have ROEs of 20% to 30%. Occasionally, companies
will boast ROEs of 40% or even higher. The higher the
percentage, the more efficient a company is in utilizing
its capital.
The best stocks of the 1996-97 period had, on average,
an ROE of 20%. For big-capitalization stocks, the average
ROE was 29%.
ROEs have been increasing over the past several decades,
largely because high technology has helped cut costs
and boost productivity.
A Quick Way To Weigh Fundamentals
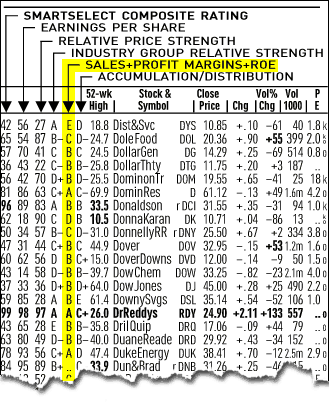
The Sales+Profit Margins+ROE (SMR) Rating -- part of
the IBD SmartSelect® Corporate Ratings
(A set of five key stock performance indicators.) --
saves you the arduous task of going over the financial
reports of every company and helps you find the best
companies in terms of financial performance. The rating
looks at a company's sales growth over the last three
quarters, its before- and after-tax margins and its
return on equity. These four fundamental factors are
widely used by analysts.
The SMR Rating ranges from A to E, with "A"
being the best and representing the top 20% of all companies.
The "B" stocks are in the next 20% and so
on. The "E" stocks represent the bottom 20%
and the lesser-quality companies. The rating also assigns
a greater value to stocks in which any or all of these
fundamental factors are accelerating. Look for stocks
with ratings of "A" or "B."

(For Sample Purposes Only)
Daily Graphs®, a stock chart service that's a sister
company of IBD, contains the SMR Rating (abbreviated
"SMR Rate") and specific figures on sales
and return on equity.
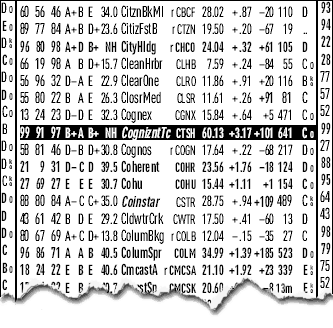
In IBD's stock tables, companies with top fundamentals
are highlighted with a black bar. Stocks are selected
weekly through a proprietary formula.

|