Holding Stocks: You've Bought a Stock--Now What?
Red Flags To Watch For
Don't assume your stock will always be a great stock.
You need to watch a number of key fundamentals (The
financial characteristics of a company, such as earnings
and sales.) for signs of trouble:
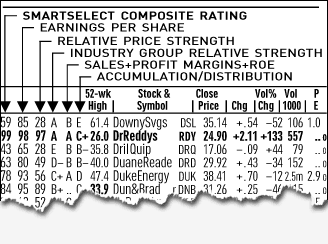
(For Sample Purposes Only)
- EARNINGS GROWTH: Is earnings growth
slipping compared to other companies? Or has the company's
earnings growth decelerated sharply in the two latest
quarters? (for example, if earnings growth has been
about 100% for several quarters and it slows down
to 25% in one quarter and then to 20%.)
You can check the earnings situation of a stock in
Investor's Business Daily's stock tables. Consider it
a red flag if the Earnings Per Share (EPS) Rating, a
part of IBD SmartSelect® Corporate Ratings,
falls below 70. Generally, you should buy established
growth stocks with an EPS Rating of 80 or higher.
What about some technology stocks with no earnings
but huge sales growth? These stocks scored some of the
biggest gains in the five months starting October 1999.
In these cases, powerful sales growth is usually the
driving factor. By the same token, a sharp drop in sales
growth could signal a slowdown.
- PRICE STRENGTH: Is the stock losing
ground relative to the rest of the market? Consider
it a red flag if the Relative Price Strength Rating
falls below 70, or drops sharply. Preferably, your
stock should have a rating of at least 80 to maintain
its leadership, and preferably 90 or higher.
- INDUSTRY LEADERSHIP: Is your stock
in an industry group in which the majority of leaders
are falling amid heavy volume? In this situation,
the other stocks in the industry will likely be vulnerable
to a sell-off. As much as half of a stock's move is
tied to its industry and sector. IBD's Industry Group
Relative Strength Rating shows how well the stock's
industry group is performing compared to 196 other
groups. The rating should be "A" or "B,"
meaning the top 40% of industries. Most stocks in
"D" and "E" rated groups should
be avoided.
- FINANCIALS: Are sales, profit margins
or return on equity faltering? You can check these
vital yardsticks of financial performance with the
Sales+Profit Margins+ROE Rating of IBD SmartSelect™
Corporate Ratings. The "A" rating represents
the top 20% of stocks. The "B" rating is
for the next 20% tier of top companies. Generally,
you'd want to see stocks with an "A" or
"B" rating. But some high-flying technology
and biotechnology stocks with groundbreaking products
have ratings of "C" or "D." That's
because they haven't turned a profit yet, and consequently
have zero margins and return on equity. What you really
need to watch for is the direction of the rating.
For example, you don't want to see a stock going from
"C" to "D" or from "B"
to "E."
- SPONSORSHIP: Is the stock losing
favor among mutual funds and other professional investors?
Funds represent the lion's share of trading activity,
so their buying and selling decisions greatly influence
stock prices. IBD's Accumulation/Distribution Rating
weighs the amount of buying vs. selling. You want
a stock that's under big demand and is rated A (the
stock is being heavily bought) or B (seeing moderate
buying). Be wary if the rating falls to D (moderate
selling) or E (heavy selling).
Here are a number of technical characteristics to watch
for with the aid of stock charts. (The lesson titled
"Using Stock Charts To Round Out Stock Selection"
has a full description of chart patterns and buy points.)
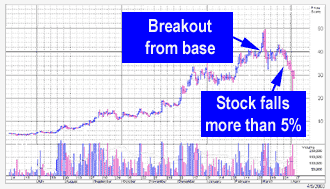
- FAILED BREAKOUTS: Your stock has
been moving sideways (in a consolidation phase) for
a number of weeks. It finally moves higher, but only
slightly, then reverses direction and declines on
heavy volume for several days. Once the stock has
retreated to 5% below the buy, or "pivot,"
point, it's time to consider selling.
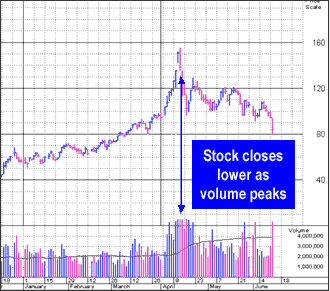
- VOLUME SPIKES: You own a stock
that's had a long advance. Then one day it closes
lower as trading volume hits the highest level since
the beginning of the advance. When volume surges like
this, it marks a pivotal vote by professional investors.
If the stock closes lower, it could be a warning that
the pros are souring on the stock and more price declines
are in store.
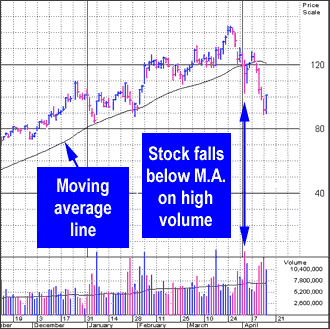
- MOVING AVERAGE: Be wary if your
stock closes several weeks in a row below its 50-day
moving average, unable to rally. (The moving average
is a line that plots the average price over the past
50 trading days. It smoothes out the daily price fluctuations
to provide a better look at the stock's overall trend.)
The moving average often serves as a "support"
level for the stock price. If it falls below the line
for a time, it could mean support has eroded.
- STOCK SPLITS: Your stock splits
a second time in less than 12 months. (Stock splits
are when a company increases its shares outstanding
and the share price is adjusted accordingly. Example:
XYZ Corp. sets a 2-for-1 split of 100 million shares
trading at $50 each. After the split, there are 200
million shares trading at $25.) This could tilt the
supply-demand equation because there's a bigger supply
of shares to go around. Daily Graphs® chart service
provides information on stock splits, and some are
noted in IBD's editorial pages.
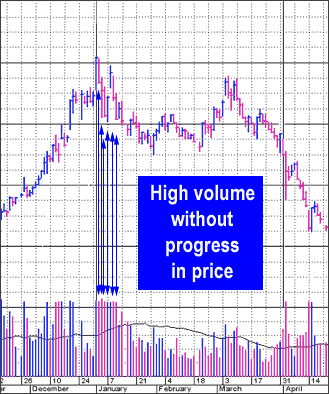
- CLUES FROM HEAVY VOLUME: After
a substantial advance, trading volume increases but
your stock price doesn't move up much for several
days. This is called churning, and it means the stock
is having difficulty making further gains even though
buying activity is high. Also potentially harmful
is when a stock falls in price on heavy volume.
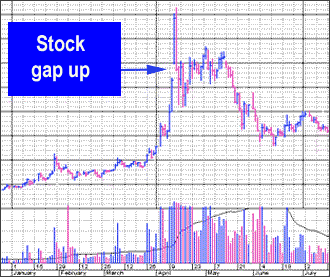
- GAP UPS: A stock that has been
climbing for several months, and is very extended
percentagewise in price, then opens trading higher
than its highest price traded for the day before.
This is called a "gap up." If a stock's
gap is unusually large, perhaps it should be sold.
- PROFESSIONAL INVESTORS: Mutual
funds and other professional investors start selling
the stock. This would show up as a drop in the Accumulation/Distribution
Rating to C or lower. A sign that top-performing funds
are moving out of a stock is when the Sponsorship
Rating falls to C or lower. You can check individual
funds' recent sells in IBD's Making Money In Mutuals
section.
investors.com
|